> ## Documentation Index
> Fetch the complete documentation index at: https://lightdash-refactor-full-audit-reorg.mintlify.site/llms.txt
> Use this file to discover all available pages before exploring further.
# How to Embed Charts
> Embed a single saved Lightdash chart with a minimal, read-only UI using the React SDK.
Embedding is available to all Lightdash Cloud users and Enterprise On-Prem customers. [Get in touch](https://lightdash.typeform.com/to/BujU5wg5) to have this feature enabled in your account.
## Overview
Chart embedding displays a single saved chart with a minimal, focused interface — a clean, distraction-free view of one visualization, scoped to that chart alone.
Chart embedding is **only available through the React SDK**. iframe embedding is not supported for charts. Chart embeds are also **read-only**: viewers can't change the configuration, apply filters, or reach Explore.
### When to use chart embedding
* **Single KPI displays**: show one key metric or visualization
* **Embedded widgets**: add analytics widgets to application pages
* **Minimal UI**: a clean, focused display with no dashboard chrome
* **Scoped access**: grant access to specific charts, not entire dashboards
### How it differs from dashboard embedding
| Feature | Dashboard embedding | Chart embedding |
| ------------- | ----------------------------- | ----------------------------------- |
| **Method** | iframe or React SDK | React SDK only |
| **Content** | Multiple tiles, tabs | Single chart |
| **Filters** | Interactive dashboard filters | Saved filters only, not interactive |
| **JWT scope** | Dashboard UUID | Chart UUID (`contentId`) |
| **Explore** | Can navigate to Explore | No Explore access |
Chart embeds support all chart types (bar, line, pie, table, big number, and so on), parameterized charts with their saved values, and — when enabled in the JWT — CSV export, image export, and viewing underlying data.
## Set up a chart embed
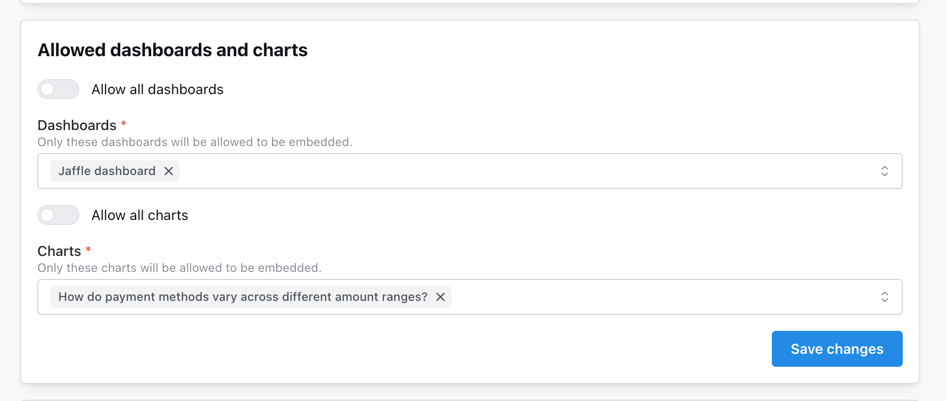
Follow the [embedding quickstart](/embed/set-up-embedding) for the shared setup: create an embed secret and generate tokens from your backend. The chart-specific part is the allowlist — each chart must be added individually under **Settings → Embed** before it can be embedded.
 ## Embed with the React SDK
Render a chart with `Lightdash.Chart`, passing the chart UUID and a server-generated token:
```tsx theme={null}
import Lightdash from '@lightdash/sdk';
function MyChart() {
return (
);
}
```
See the [React SDK reference](/embed/react-sdk#lightdashchart) for installation, CORS setup, props, and styling.
## Configure what viewers can do
A chart token is scoped to one chart via `content.contentId` (the saved chart UUID). Inside `content`, you can allow CSV export, image export, and viewing underlying data. For the full schema, see the [chart token](/embed/reference#chart-token) in the embedding reference.
```javascript theme={null}
import jwt from 'jsonwebtoken';
const token = jwt.sign({
content: {
type: 'chart',
projectUuid: 'your-project-uuid',
contentId: 'your-chart-uuid',
canExportCsv: true,
canExportImages: true,
canViewUnderlyingData: true,
},
user: {
externalId: 'user-123',
email: 'user@example.com',
},
}, LIGHTDASH_EMBED_SECRET, { expiresIn: '24h' });
```
Parameter values are fixed when the chart is saved. A chart embed displays the chart with its saved parameter configuration.
## Limitations
Chart embeds are always read-only and single-scope. Compared to dashboard embeds, viewers **cannot** modify dimensions, metrics, or visualization type; add or change filters (including via the SDK `filters` prop); reach the Explore view or underlying data model; or access any content beyond the chart named in `contentId`.
If you need interactive filters or exploration, use [dashboard embedding](/embed/embed-dashboards) instead, or reach out with your use case.
## Example: single KPI widget
Drop a key metric into your own layout and let the chart background go transparent so it inherits your styling:
```tsx theme={null}
## Embed with the React SDK
Render a chart with `Lightdash.Chart`, passing the chart UUID and a server-generated token:
```tsx theme={null}
import Lightdash from '@lightdash/sdk';
function MyChart() {
return (
);
}
```
See the [React SDK reference](/embed/react-sdk#lightdashchart) for installation, CORS setup, props, and styling.
## Configure what viewers can do
A chart token is scoped to one chart via `content.contentId` (the saved chart UUID). Inside `content`, you can allow CSV export, image export, and viewing underlying data. For the full schema, see the [chart token](/embed/reference#chart-token) in the embedding reference.
```javascript theme={null}
import jwt from 'jsonwebtoken';
const token = jwt.sign({
content: {
type: 'chart',
projectUuid: 'your-project-uuid',
contentId: 'your-chart-uuid',
canExportCsv: true,
canExportImages: true,
canViewUnderlyingData: true,
},
user: {
externalId: 'user-123',
email: 'user@example.com',
},
}, LIGHTDASH_EMBED_SECRET, { expiresIn: '24h' });
```
Parameter values are fixed when the chart is saved. A chart embed displays the chart with its saved parameter configuration.
## Limitations
Chart embeds are always read-only and single-scope. Compared to dashboard embeds, viewers **cannot** modify dimensions, metrics, or visualization type; add or change filters (including via the SDK `filters` prop); reach the Explore view or underlying data model; or access any content beyond the chart named in `contentId`.
If you need interactive filters or exploration, use [dashboard embedding](/embed/embed-dashboards) instead, or reach out with your use case.
## Example: single KPI widget
Drop a key metric into your own layout and let the chart background go transparent so it inherits your styling:
```tsx theme={null}
Monthly Revenue
```
Pass `user` metadata in the token to attribute queries in [usage analytics](/workspace-admin/usage-analytics#query-tags), and `userAttributes` for row-level security. Styling and localization props are covered in the [React SDK reference](/embed/react-sdk#lightdashchart).
## Next steps
Complete chart JWT structure and options
Props, styling, and localization for the Chart component
Embed multiple charts with filters and interactivity
Show different data to different users