

The chart timezone badge
Every chart in Explore and on dashboards shows a small badge with its resolved timezone, for example(UTC +01:00) Europe/London. It’s the zone the chart’s filters, buckets, and values use, resolved by the rules in Report timezone resolution.
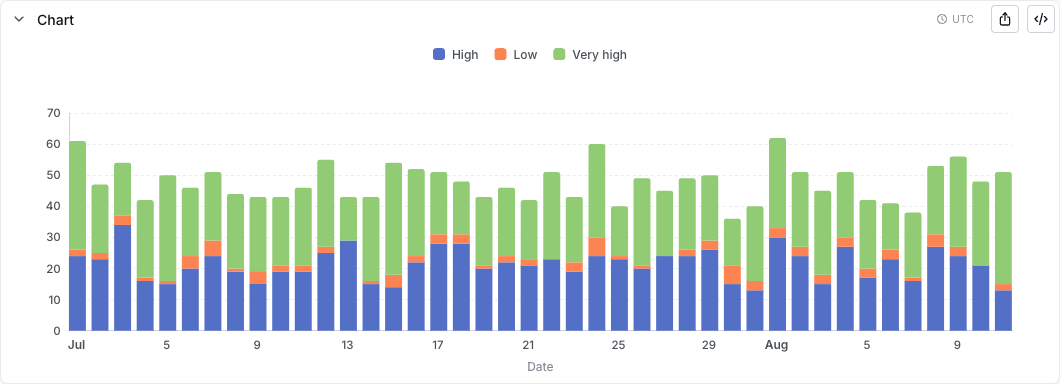
Report timezone resolution
A chart’s own timezone setting decides what zone it uses, unless an embed overrides it. The zone it ends up using is its resolved timezone, the term used throughout this guide. From highest priority:- A direct embed’s
timezoneURL parameter (on iframe or shareable-URL embeds only, see Embedded dashboards). This outranks everything. - Otherwise, the chart’s timezone setting applies:
- Project timezone (the default): the project’s timezone, for every viewer.
- User timezone: the viewer’s profile timezone, or the project timezone if they haven’t set one.
- A specific timezone: that exact zone, the same for everyone.
Choosing a chart timezone
Open the Run query settings (the dropdown next to the Run query button in Explore) and use the Timezone picker to choose how the chart resolves its zone. There are three options: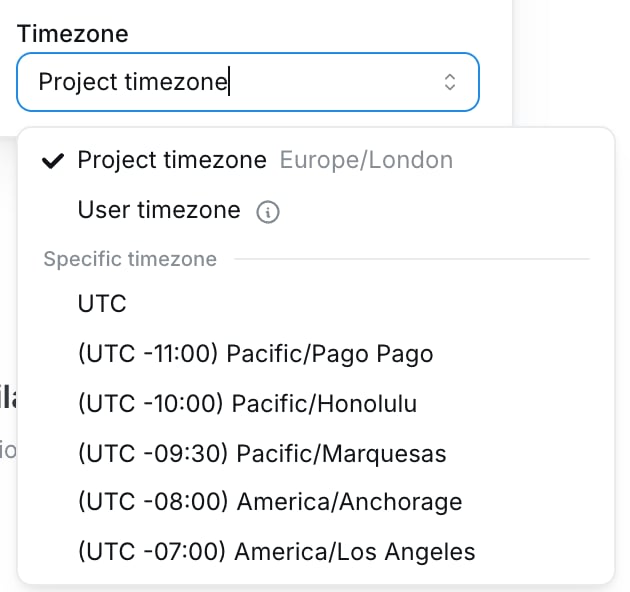
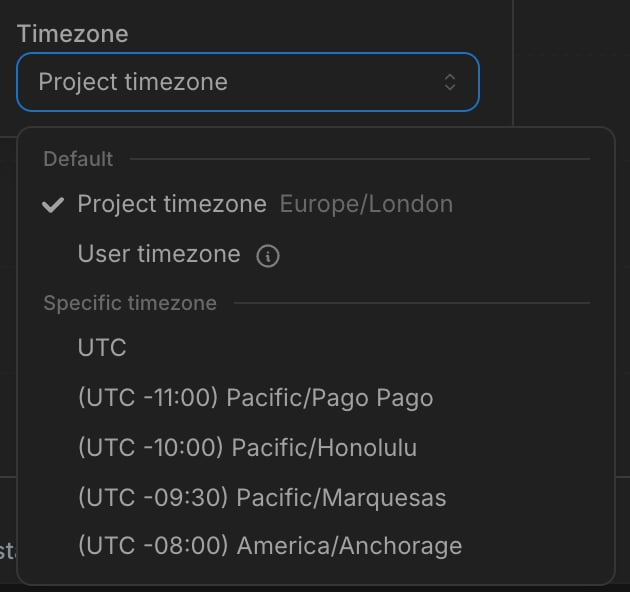
Project timezone is the default, and it is not frozen at save time: it always resolves to the current project timezone, so a later change to the project setting flows through to the chart.
How filters work
Relative date filters
Relative filters like “yesterday,” “last 7 days,” and “this month” are computed in the chart’s resolved timezone. On a chart resolved to America/New_York, “yesterday” is the day that just ended in New York.Absolute date filters
Absolute date filters (a specific date or range) are unambiguous.2024-03-15 is 2024-03-15, and behaves the same for every viewer.
Filters that include a time of day (for example “events after 9am on March 15”) are more subtle. By default the datetime picker works in each viewer’s browser timezone, so the same typed value can resolve to a different moment for different viewers.
To keep these filters consistent, a project admin can turn on Project time zone in filter inputs in Project settings → Timezone. Set a project timezone first; the toggle is disabled until one is set.


- The picker shows and interprets values in the project timezone, so the same typed value means the same moment for everyone.
- A line under the picker shows the equivalent local time, and a label shows the active timezone.
- Existing saved filters aren’t rewritten. They keep the same moment, just shown in the new zone.


Cell-click filters
Clicking a bar or cell filters on the value as shown, not the underlying instant. Click “March 2024” and you get March 2024 in the chart’s timezone, exactly what you saw.Day-grouped vs hour-grouped charts
Day and hour groupings respond to timezone differently, which changes how charts look across viewers.Day-or-coarser grouping
A chart grouped by day, week, month, quarter, or year buckets data by calendar boundaries, so when the resolved timezone changes (for example on a User-timezone chart) those boundaries move and the same events can land in different bars. Two viewers can then see different numbers on the same daily chart. This is correct, since each sees their own calendar, but it can be surprising. See Choosing a chart timezone to control it.Sub-day grouping
A chart grouped by hour, minute, or smaller buckets data by instants. The boundaries are the same for every viewer; only the labels shift (your “9am EDT” is someone else’s “2pm BST,” but the bar contains the same events). Sub-day grouping is consistent across viewers. The exception is half-hour and 45-minute offset zones (India, Nepal, parts of Australia), where bucket boundaries don’t align with whole-hour zones.MIN/MAX date and timestamp metrics
Amin or max metric renders by the type of the column it aggregates, following the same calendar-vs-instant rule as dimensions:
DATEcolumn (or a day-or-coarser date interval like_month): a plain calendar date at that grain, never shifted.TIMESTAMPcolumn: shifted into the resolved timezone, like a timestamp dimension.
Custom MIN/MAX metrics built in the Explore view pick this up automatically. Metrics defined in dbt or Lightdash YAML need a project recompile (Refresh dbt or
lightdash deploy) before the new formatting applies.Daylight-saving transitions
Lightdash buckets data by local time in the resolved timezone, so daylight-saving transitions show up in your charts.- On a daily chart, the fall-back day spans 25 hours and the spring-forward day spans 23. Each bar still counts exactly the events in that calendar day, and drilling in returns them all.
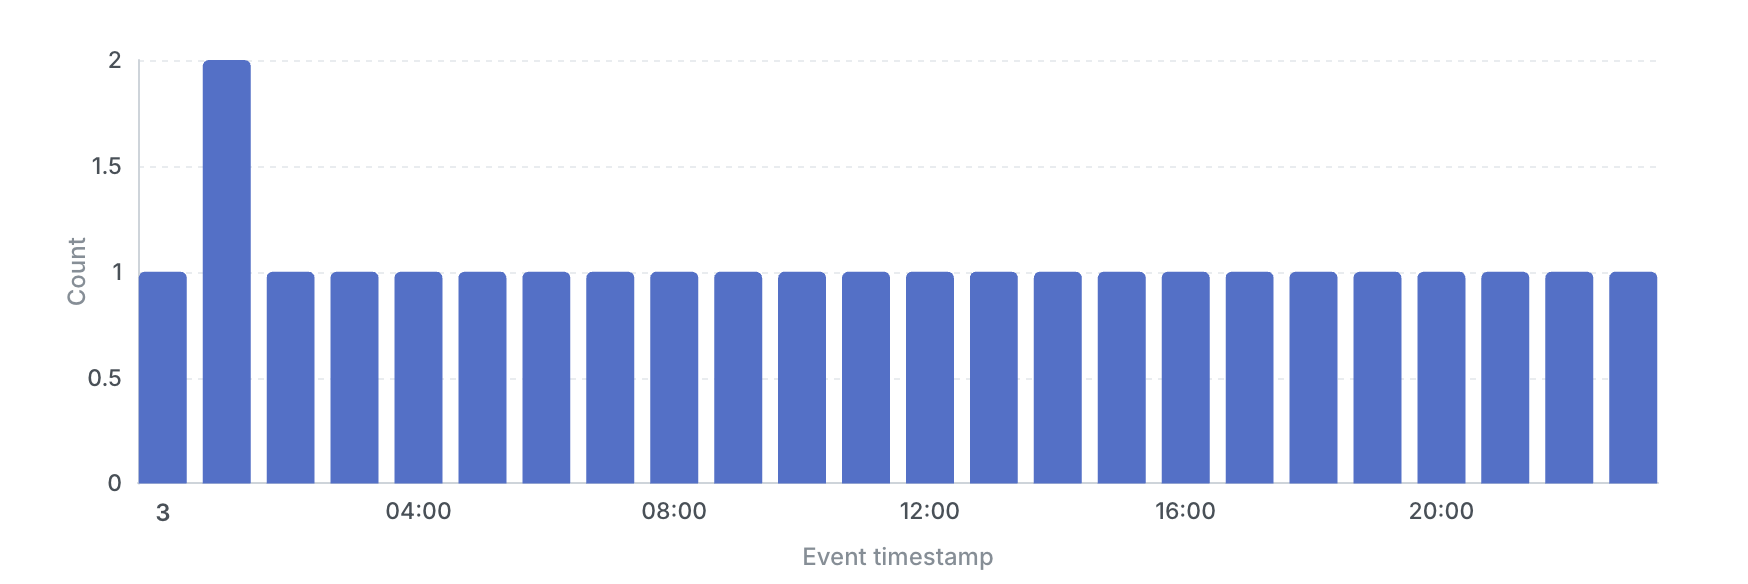
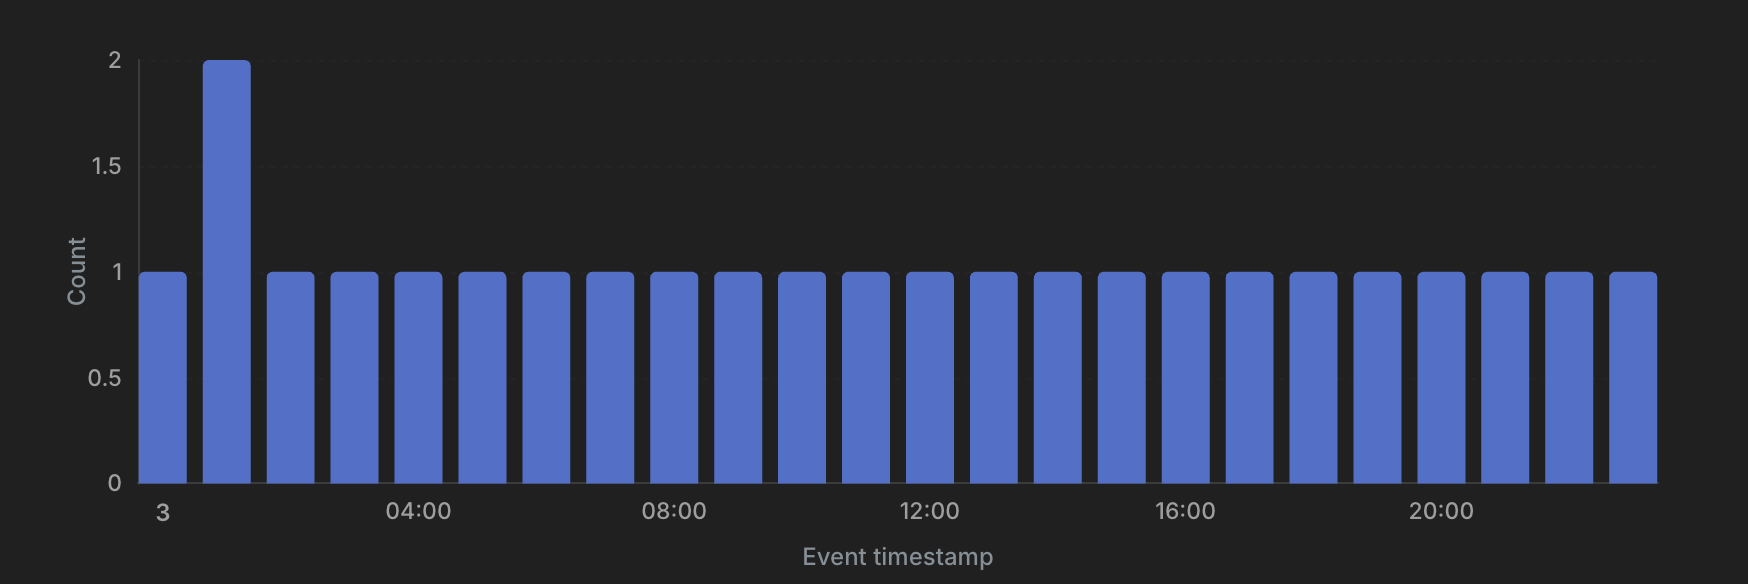
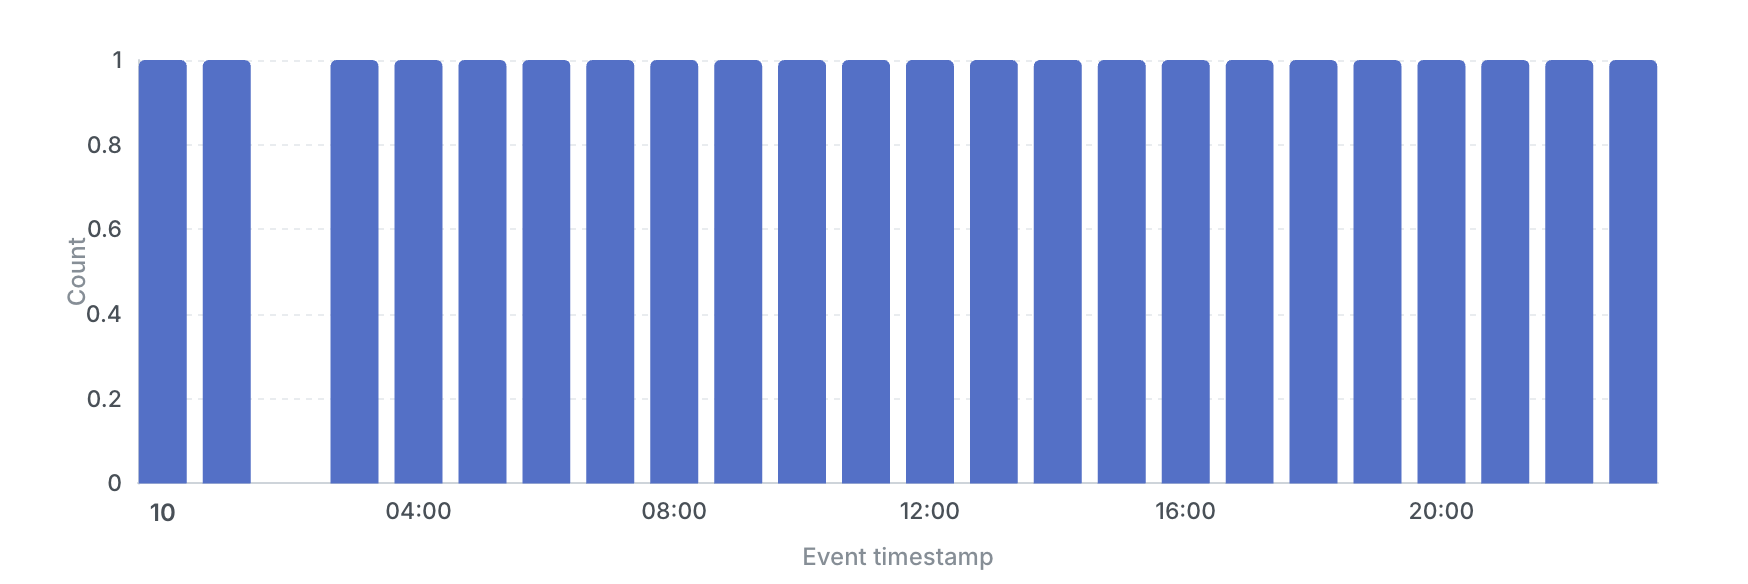
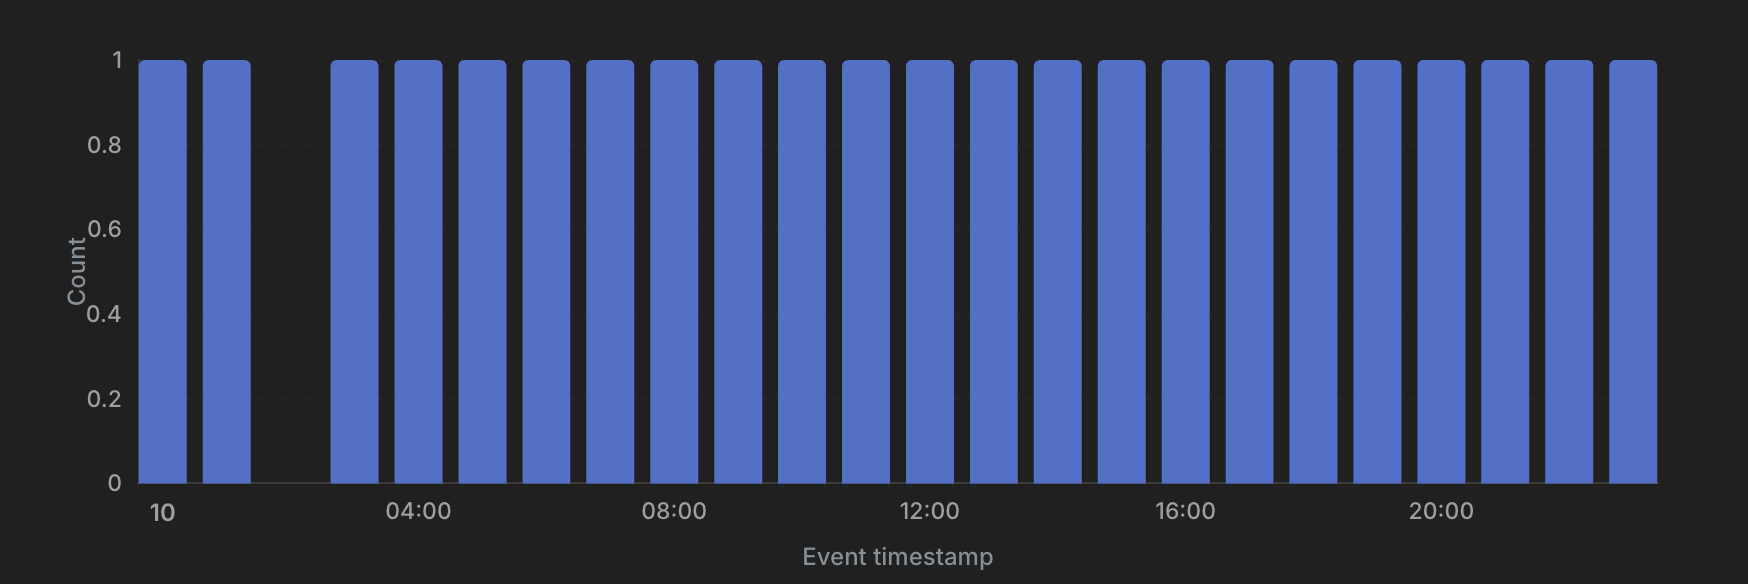
- On an hourly chart, the two 1 AM hours on the fall-back day merge into a single bar with double the count, and the missing 2 AM hour on the spring-forward day simply has no bar.
Your profile timezone
In your Profile settings, you can set a Default timezone. It affects only charts set to User timezone, which resolve to your profile zone when you view them. It does not affect:- Charts set to Project timezone or to a specific timezone.
- Embedded dashboards (an embed has no viewer profile to read).
Dashboards
Every chart on a dashboard keeps its own timezone setting, so one dashboard can mix Project-timezone charts (same for everyone) with User-timezone charts (per viewer). Each chart’s badge shows the zone it resolved to. A dashboard date filter sends the same value to every chart, but each chart reads it in its own zone. So a “last 7 days” filter can cover a different window on a Project-timezone chart than on the User-timezone chart next to it.Scheduled deliveries
Scheduled reports have two independent timezone settings:
The two don’t have to match. A delivery scheduled for “9am New York” can contain a chart in UTC: the report fires at 9am New York and shows UTC-bucketed data.
For most schedules, the cleanest setup is:
- Delivery time in the recipient’s working timezone (so the report arrives at a useful hour).
- Chart data on the project timezone (so the numbers are consistent and explicable).
Embedded dashboards
An embedded dashboard has no signed-in viewer, so there’s no profile timezone to read. Its zone resolves one of two ways:- A
timezoneURL parameter sets one zone for the whole session and overrides every chart. Available on direct iframe and shareable-URL embeds only, not the React SDK. See embedding URL parameters. - Otherwise, each chart uses its own setting: the project timezone, or a specific zone if one was pinned. A User-timezone chart falls back to the project, since there’s no profile to read.
When things go wrong
Common symptoms and their usual causes. When something looks off, the chart’s badge and the connection’s data-timezone preview show exactly what Lightdash is using.Two viewers see different numbers on the same chart
Two viewers see different numbers on the same chart
This usually means the chart is on User timezone, so each viewer gets their own day boundaries. Check the chart’s badge and switch it to Project timezone if everyone should match.
All timestamps are off by an hour or more
All timestamps are off by an hour or more
The data timezone on the connection is probably incorrect. Open Project settings → Connection → Data timezone and use Preview to confirm how values are read.
A CSV export shows different times than the Lightdash UI
A CSV export shows different times than the Lightdash UI
The export may have run with a different chart timezone. Re-export from a chart set to the zone you want.
A 'yesterday' filter returns no data, but yesterday clearly has data
A 'yesterday' filter returns no data, but yesterday clearly has data
Your project timezone might be set to a zone where “yesterday” hasn’t started yet. Check it under Project settings → Timezone.
An hourly chart looks like it skipped or doubled an hour
An hourly chart looks like it skipped or doubled an hour
This is likely a daylight-saving transition in the period shown. Switch the chart to UTC to confirm it’s a DST artifact, not a data problem.
Example: one row, four configurations
Imagine one row in yourorders table:
Same row, same warehouse. Here’s what changes as you layer settings on.
The pattern. Timestamp rendering and bucketing shift with the resolved zone. DATE values never shift. But anything derived from “now” (relative filters) always uses the resolved zone, regardless of column type.